Intro
Here’s another FiveThirtyEight puzzle from The Riddler. This post is an answer to the Riddler Classic https://fivethirtyeight.com/features/can-you-win-riddler-jenga/.
Question
In the game of Jenga, you build a tower and then remove its blocks, one at a time, until the tower collapses. But in Riddler Jenga, you start with one block and then place more blocks on top of it, one at a time. All the blocks have the same alignment (e.g., east-west). Importantly, whenever you place a block, its center is picked randomly along the block directly beneath it.
On average, how many blocks must you place so that your tower collapses — that is, until at least one block falls off? (Note: This problem is not asking for the average height of the tower after any unbalanced blocks have fallen off. It is asking for the average number of blocks added in order to make the tower collapse in the first place.)
Answer
On average, at least one block falls off the tower when the 7th block is placed.
Research into toppled towers
This type of block-stacking problem is related to the Leaning Tower of Lire problem. Here’s a nice blog post that walks through the logic https://datagenetics.com/blog/may32013/index.html, but basically, the center of mass of blocks above any one block must be within the edges of that one block.
Setup in R
R6
library(tidyverse)
## -- Attaching packages --------------------------------------- tidyverse 1.3.0 --
## v ggplot2 3.3.3     v purrr   0.3.4
## v tibble  3.0.4     v dplyr   1.0.2
## v tidyr   1.1.2     v stringr 1.4.0
## v readr   1.4.0     v forcats 0.5.0
## -- Conflicts ------------------------------------------ tidyverse_conflicts() --
## x dplyr::filter() masks stats::filter()
## x dplyr::lag()    masks stats::lag()
library(R6)
R6 is R’s way to do proper object-oriented programming. Objects in R6 have attributes and methods, and they are able to self-reference. Both the R6 documentation page (https://r6.r-lib.org/articles/Introduction.html) and Hadley Wickham’s R6 chapter in Advanced R are excellent references (https://adv-r.hadley.nz/r6.html).
One reason I wanted to use R6 is that I’ve been working with OpenAPI codegen recently, and it takes webAPI documentation in the swagger/openapi specification and creates webAPI R packages using R6 objects. Codegen can also create packages/libraries for many different programming languages. Check out the Github page https://github.com/OpenAPITools/openapi-generator. Look for a future blog post (and maybe a YouTube tutorial) about this particular topic because I couldn’t find a thorough walkthrough for R.
Anyway, on to the problem.
Create block R6 object
The block objects just have to know their placement. Let every block be length 1, and let their centers be placed along a uniform random line between -0.5 and 0.5. To accomplish this using R6, we give the block object a placement attribute ,and then we initialize the block object by assigning the placement a number from a random uniform distribution.
block <- R6Class("block",
  public = list(

    # where will the block be placed
    placement = NULL,

    initialize = function(){
      self$placement <- runif(n = 1, min = -.5, max = .5)
    }
  )
)
Create tower R6 object
Tower objects are trickier. I’m not as familiar with object-oriented programming, so I did a bit of punting and allowed the tower object to have a dataframe inside it. That another nice part about R6 though, it’s flexible.
Every time I create a tower, I want to know the current height (and I found I needed previous height enough to add it), a numeric vector for center of mass above each block, a Boolean vector for whether each block is balanced, and a dataframe of blocks with their positions in the tower, placements, and overall location.
Where you start the tower is arbitrary because it builds relative to that zero, but it is easiest to place it at 0. The initialize function shows the first block of the tower and the new tower attributes.
The add_block function shows how the attributes change when you add a block: the heights increase, you add a row to the dataframe, and you recalculate center of mass and the balance.
calculate_c_o_m is a function that loops through each block in the tower and calculates the center of mass above each block. The top block, most recently added to the stack, has nothing above it. However, to keep dimensions the same, I set the final center of mass to be the top block’s center.
The check_balance function compares the center of mass vector to the block edges. For each block, is_balanced = TRUE if the center of mass above is within the boundaries of its edges.
tower <- R6Class("tower",
  public = list(
    previous_height = NULL,
    height = NULL,
    center_of_mass_above = NULL,
    is_balanced = NULL,
    blocks = NULL,

    initialize = function(){
      self$previous_height <- 0
      self$height <- 1
      self$center_of_mass_above <- 0
      self$is_balanced <- TRUE
      self$blocks <- data.frame(position = 1,
                                placement = 0,
                                location = 0)
    },

    add_block = function(block){
      self$previous_height <- self$height

      self$height <- self$height + 1

      self$blocks <- rbind(self$blocks,
                           cbind(position = self$height,
                                 placement = block$placement,
                                 location = block$placement +
                                   self$blocks[self$previous_height, "location"]))

      self$center_of_mass_above <- self$calculate_c_o_m()

      self$is_balanced <- self$check_balance()
    },

    calculate_c_o_m = function() {
      if (self$height == 1) {
        c_o_m_above  = 0
      } else {

        c_o_m_above = NULL

        for (i in 1:self$previous_height) {
          c_o_m_above[i] = mean(self$blocks[((i+1):self$height), ]$location)
        }
      }

      c(c_o_m_above,self$blocks$location[self$height])
    },

    check_balance = function(){

      (self$center_of_mass_above < self$blocks$location[1:(self$height)] + .5 &
         self$center_of_mass_above > self$blocks$location[1:(self$height)] - .5)


    }
  )
)
How it works
Now we can create a new tower and see how it works. To create an R6 variable, you call the new() function which is a metafunction common to all R6 objects, and internally calls the initialize function we created above. Here’s what that looks like, and we can see that we have an object called new_tower that is a <tower> R6 object with the attributes assigned above, plus a few extra attributes that all R6 objects have.
new_tower = tower$new()
new_tower
## <tower>
##   Public:
##     add_block: function (block)
##     blocks: data.frame
##     calculate_c_o_m: function ()
##     center_of_mass_above: 0
##     check_balance: function ()
##     clone: function (deep = FALSE)
##     height: 1
##     initialize: function ()
##     is_balanced: TRUE
##     previous_height: 0
To add a new block, we use our new_tower object and give it a new block object directly. We don’t need to reassign the object because of the self-referencing and self-contained properties of R6 objects.
new_tower$add_block(block$new())
new_tower
## <tower>
##   Public:
##     add_block: function (block)
##     blocks: data.frame
##     calculate_c_o_m: function ()
##     center_of_mass_above: 0.172969678184018 0.172969678184018
##     check_balance: function ()
##     clone: function (deep = FALSE)
##     height: 2
##     initialize: function ()
##     is_balanced: TRUE TRUE
##     previous_height: 1
The default print view only shows the attribute block as a dataframe, but we can view it.
new_tower$blocks
##   position placement  location
## 1        1 0.0000000 0.0000000
## 2        2 0.1729697 0.1729697
Graph it!
new_tower$blocks %>%
  mutate(balanced = new_tower$is_balanced,
         com = new_tower$center_of_mass_above) %>%
    ggplot()+
    geom_rect(aes(ymin = position-1, ymax = position,
                  xmin = location-.5, xmax = location +.5,
                  fill = balanced),
              alpha = .75,
              color = "white")+
    geom_segment(aes(y = position-1, yend = position, x = location, xend = location))+
    geom_point(aes(x = com, y = position,
                   alpha = ifelse(position == max(position),0,1),
                   pch = "Center\nof Mass \nAbove"))+
    scale_alpha_identity()+
    scale_fill_manual(values = c("TRUE" = "forestgreen",
                                 "FALSE" = "firebrick"))+
    labs(y = "height",
         shape = "")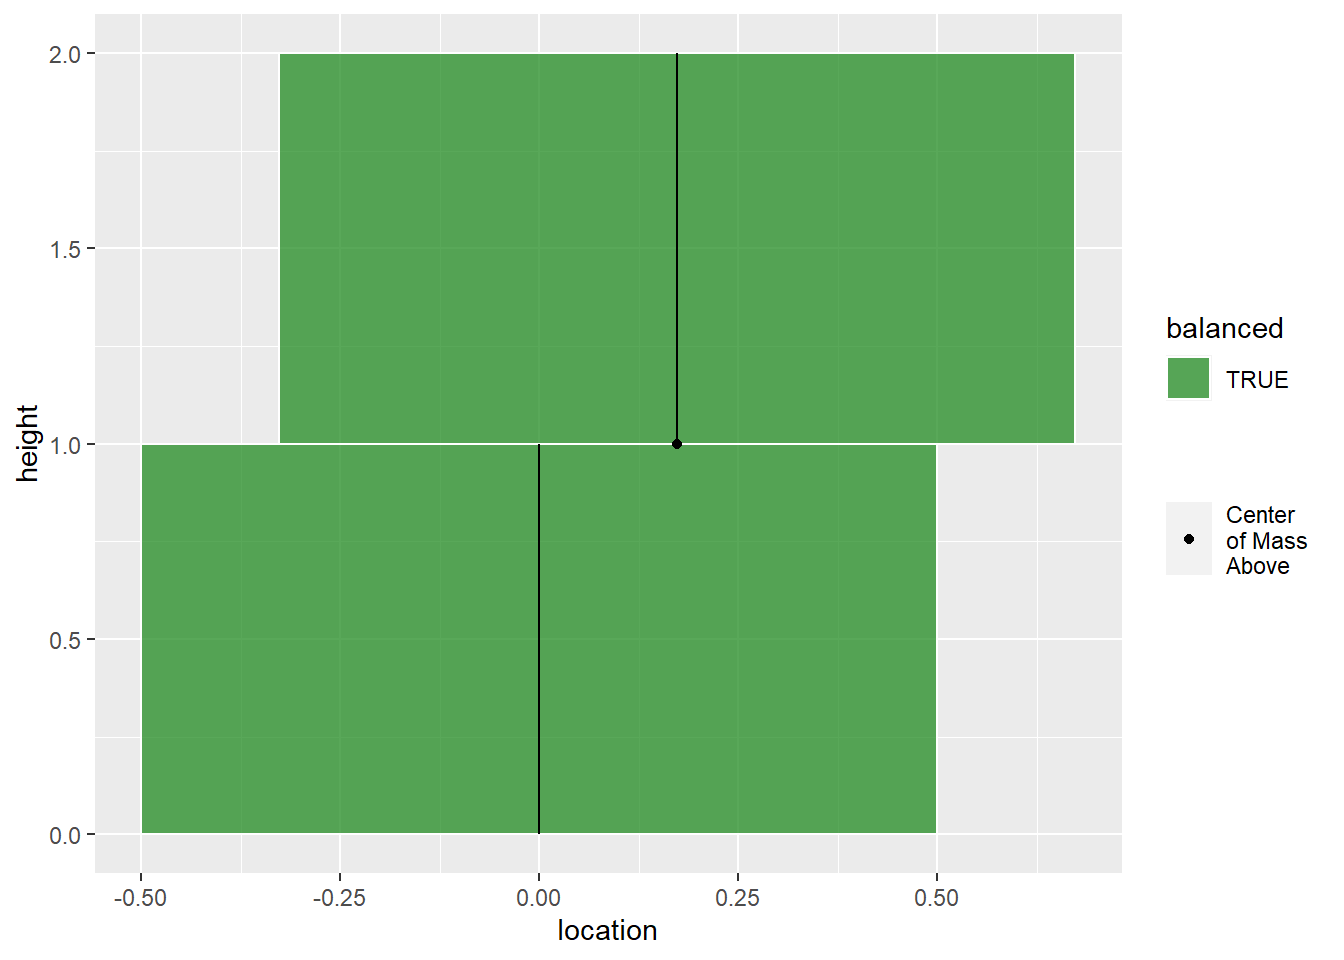
Simulation
Okay, now I’ve got things setup for simulation. Let’s do this a bunch of times. I want to build towers until they are not balanced, and I want to repeat it many times. I’m using a for-loop with a nested while-loop to accomplish this. Because it takes a bit of time, I like to watch a progress bar…which doesn’t really come through on the blog.
samps = 5e4
tower_list = list(block_df= list(),
                  heights = NA,
                  c_o_m_above = list(),
                  balanced = list(),
                  plot_list = list())

pb <- progress::progress_bar$new(total = samps,
                                 format = " running [:bar] :percent eta: :eta",
                                 clear = FALSE, width= 60)

for (i in 1:samps){
  new_tower = tower$new()

  while(all(new_tower$is_balanced)){
    new_tower$add_block(block$new())
  }

  balance_df = new_tower$blocks %>%
    mutate(balanced = new_tower$is_balanced,
           com = new_tower$center_of_mass_above)

  tower_list$block_df[[i]] = new_tower$blocks
  tower_list$heights[i] = new_tower$height
  tower_list$c_o_m_above[[i]] = new_tower$center_of_mass_above
  tower_list$balanced[[i]] = new_tower$is_balanced


  tower_list$plot_list[[i]] =
    ggplot(balance_df)+
    geom_rect(aes(ymin = position-1, ymax = position,
                  xmin = location-.5, xmax = location +.5,
                  fill = balanced), alpha = .75, color = "white")+
    geom_segment(aes(y = position-1, yend = position, x = location, xend = location))+
    geom_point(aes(x = com,  y = position,
                   alpha = ifelse(position == max(position),0,1),
                   pch = "Center\nof Mass \nAbove"))+
    scale_fill_manual(values = c("TRUE" = "forestgreen",
                                 "FALSE" = "firebrick"))+
    scale_alpha_identity()+
    labs(y = "height",
         shape = "")


  pb$tick()

}
Histogram
Let’s take a look at the distribution.
hist(tower_list$heights, breaks = 30)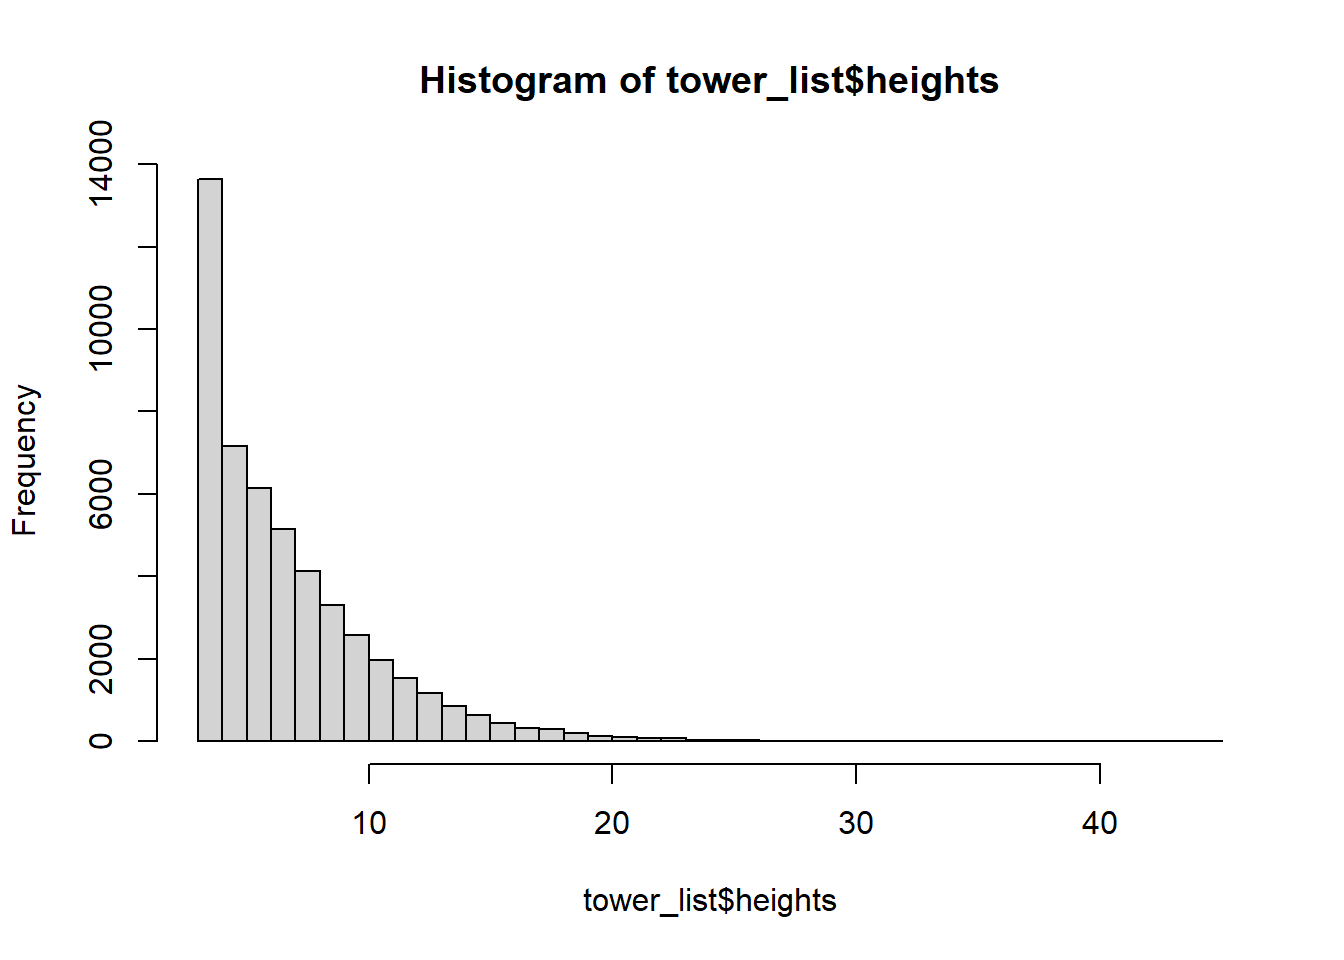
Convergence of the mean
Now let’s check for convergence and find the mean.
plot(cummean(tower_list$heights), type = 'l', ylab = "tower height")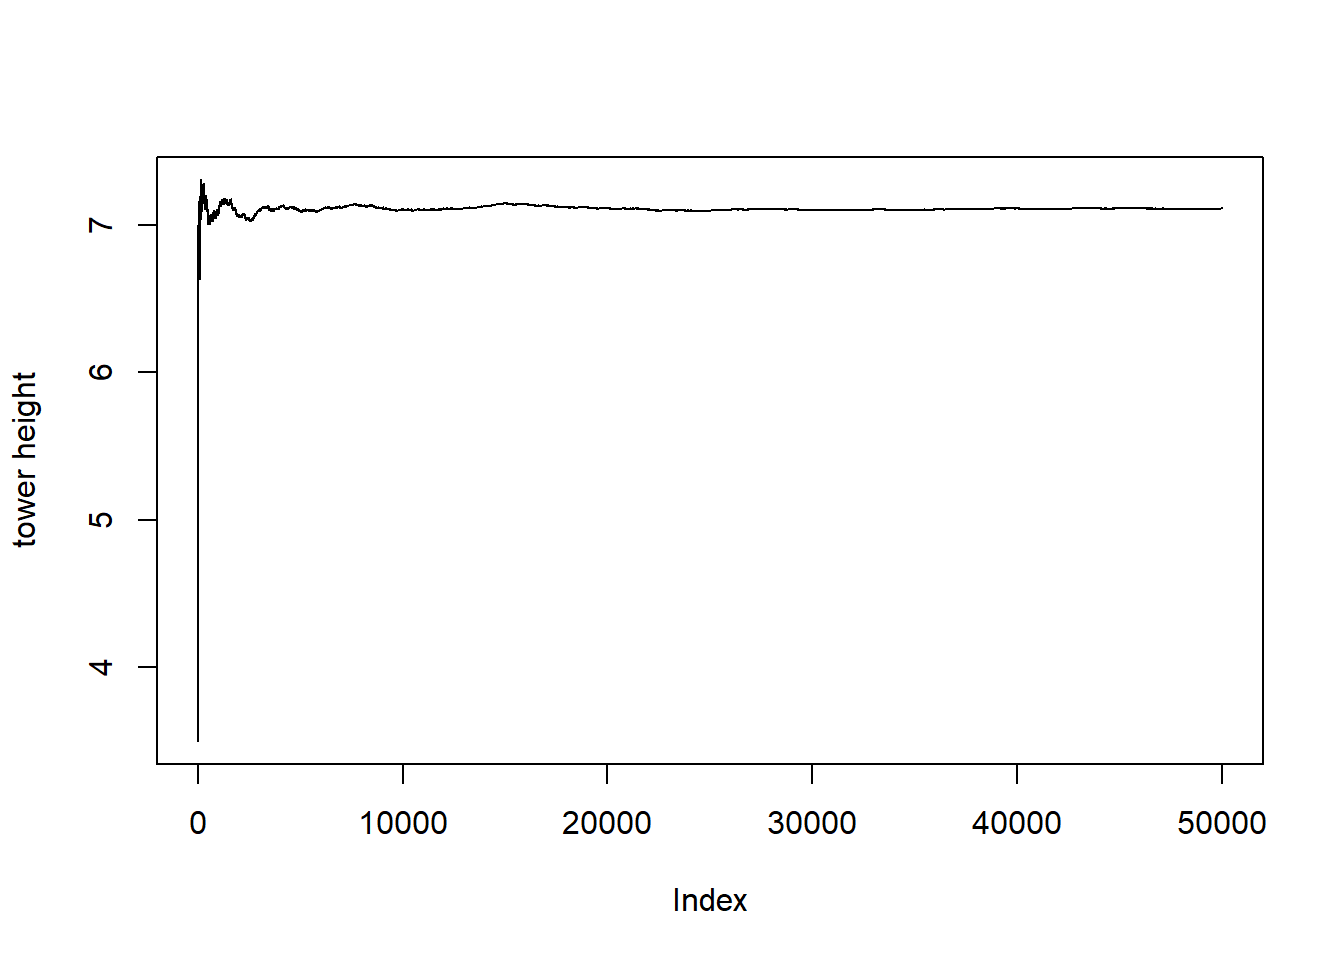
mean_tower_height = mean(tower_list$heights)
mean_tower_height
## [1] 7.11002
We’ve got a bit of burn-in going on with the cumulative mean function, so let’s trim off the first 10,000 iterations.
plot(x = 10000:samps,
     y = cummean(tower_list$heights)[10000:samps],
     type = 'l',
     ylab = "tower height",
     xlab = "index",
     ylim = c(mean_tower_height-.1, mean_tower_height+.1))
abline(h = mean_tower_height, col = "red")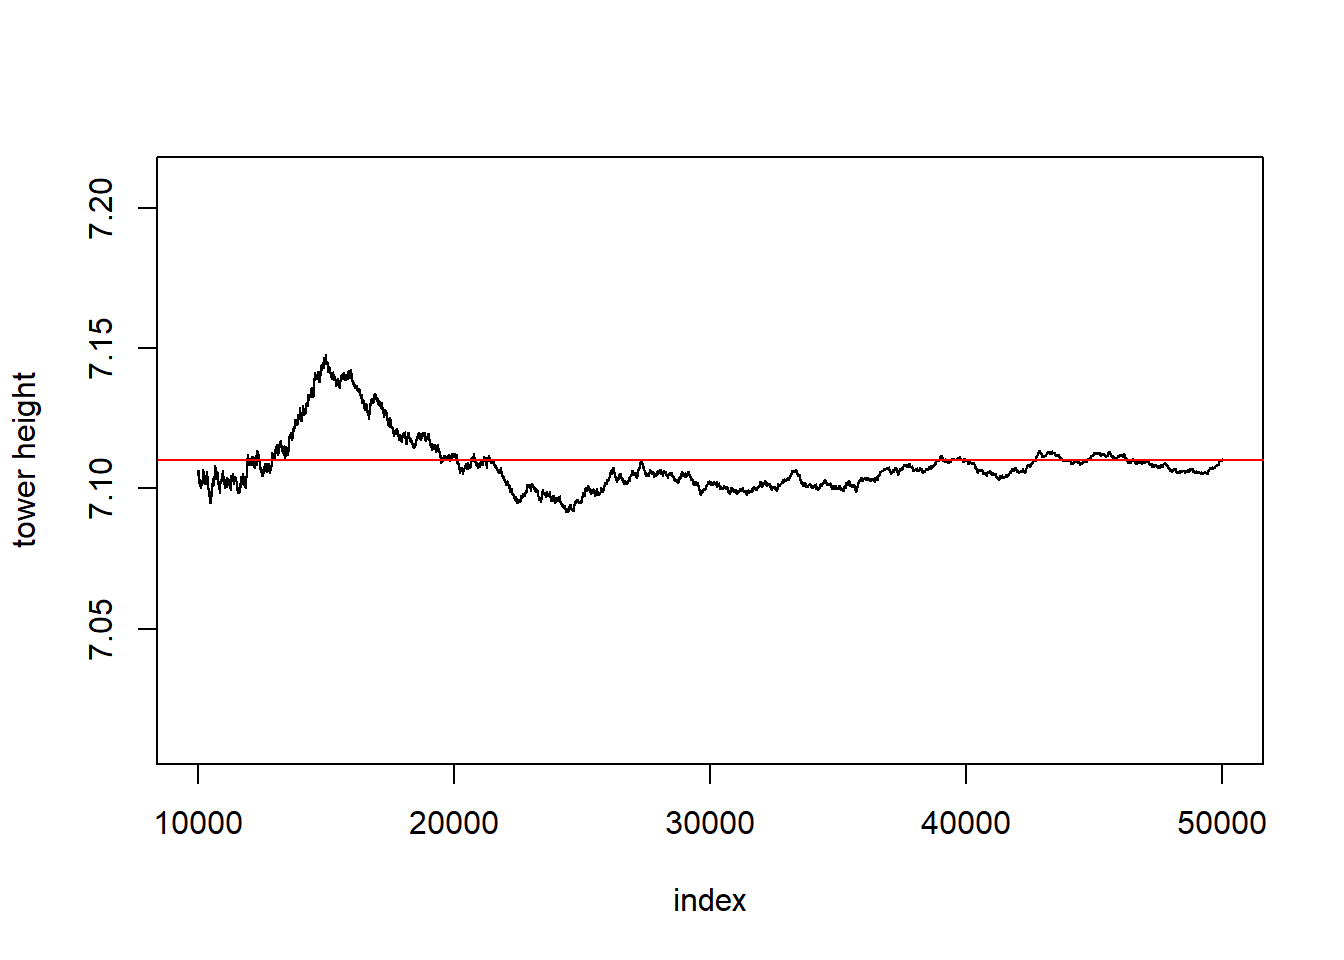
This looks pretty close to convergence to me, so let’s call the expected height 7 and the average height 7.11.
Biggest tower
Just for fun, let’s take a look at the biggest tower this simulation created.
tower_list$plot_list[[which.max(tower_list$heights)]]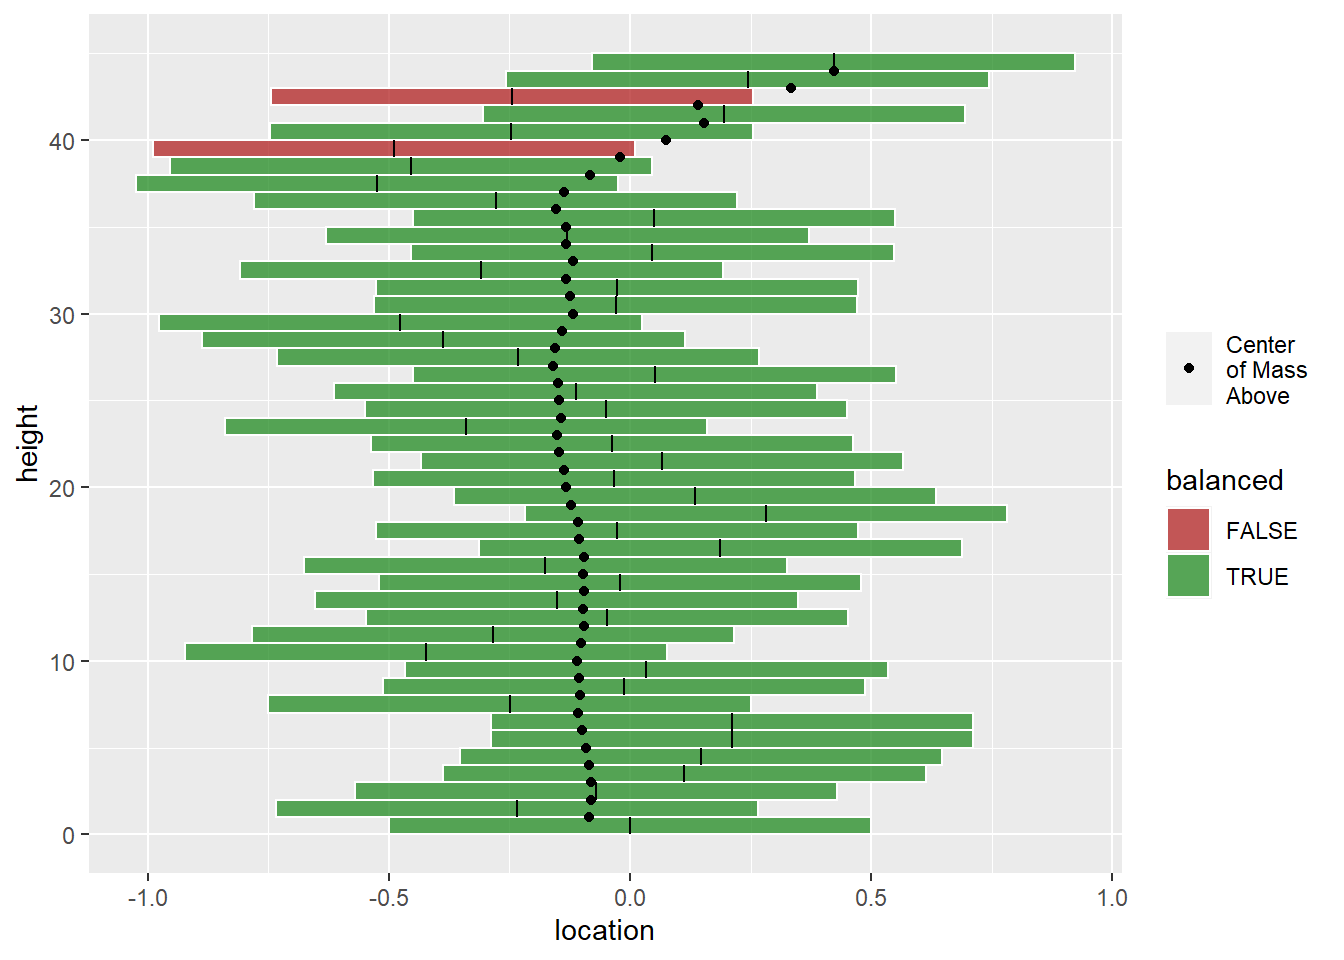
GGAnimate
library(gganimate)Looking at things after-the-fact is fine, but I think watching how it develops is more interesting. Thomas Lin Pedersen and David Robinson have developed a nice package called gganimate to turn ggplots into gifs or other video files. Here’s their site https://gganimate.com/. I like gganimate because it’s pretty straightforward, and if you really want to get something just so, you can build the frames individually. That’s what I’m doing here.
Create a big dataframe
In this example, we’re make a gif that shows how 5 different towers develop. First we need the tower data. Make an outer for-loop from 1 through 5 representing the different towers, and an inner while-loop that adds blocks while the towers are balanced. Instead of saving the results in a list, I’m going to add the blocks to a dataframe called super_df with extra columns to represent the place in the loops. Those loop place columns are called frame and stack, and together we’ll use them to create the animation frames.
super_df = tibble()

for(i in 1:5){

  new_tower = tower$new()
  j=1
  while(all(new_tower$is_balanced)){
    super_df = super_df %>%
      union_all(new_tower$blocks %>%
                  mutate(frame = str_pad(j,2,"left"),
                         stack = i,
                         balanced = new_tower$is_balanced,
                         com = new_tower$center_of_mass_above)
                )
    new_tower$add_block(block$new())
    j = j+1
  }
  super_df = super_df %>%
    union_all(new_tower$blocks %>%
                mutate(frame = str_pad(j,2,"left"),
                       stack = i,
                       balanced = new_tower$is_balanced,
                       com = new_tower$center_of_mass_above)
    )
  j = j+1

}
head(super_df)
## # A tibble: 6 x 7
## position placement location frame stack balanced com
## <dbl> <dbl> <dbl> <chr> <int> <lgl> <dbl>
## 1 1 0 0 " 1" 1 TRUE 0
## 2 1 0 0 " 2" 1 TRUE -0.0204
## 3 2 -0.0204 -0.0204 " 2" 1 TRUE -0.0204
## 4 1 0 0 " 3" 1 TRUE 0.182
## 5 2 -0.0204 -0.0204 " 3" 1 TRUE 0.385
## 6 3 0.405 0.385 " 3" 1 TRUE 0.385Animation Prep
I realized that the animation was moving a bit too fast when it reached the tipping point, so this code chuck adds extra time when each tower has reached its tipping point. I’ve shown the tail of the dataframe to guarantee that you can see the extra time in the frame_time column.
animation_things = super_df %>%
  group_by(stack, frame) %>%
  summarize(tipping_point = all(balanced)) %>%
  ungroup() %>%
  mutate(frame_id = row_number(),
         frame_time = ifelse(tipping_point,1,5))
tail(animation_things)
## # A tibble: 6 x 5
## stack frame tipping_point frame_id frame_time
## <int> <chr> <lgl> <int> <dbl>
## 1 4 " 2" TRUE 24 1
## 2 4 " 3" FALSE 25 5
## 3 5 " 1" TRUE 26 1
## 4 5 " 2" TRUE 27 1
## 5 5 " 3" TRUE 28 1
## 6 5 " 4" FALSE 29 5Initialize animation
This is mostly the same code used to graph the towers above, but it has a few changes. The biggest one is adding the gganimate function transition_states to the end of my plot. This is going to split super_df into frames based on the states, and I’ve set the amount of time for transitions and pauses. I’ve also added a group aesthetic so there isn’t and overlap between frames, and I’ve added a title that uses the state shows in the transition_states call.
anim = ggplot(super_df, aes(group = paste(stack, frame)))+
  geom_rect(aes(ymin = position-1, ymax = position,
                xmin = location-.5, xmax = location +.5,
                fill = balanced),
            alpha = .75,
            color = "white")+
  geom_segment(aes(y = position-1, yend = position, x = location, xend = location))+
  geom_point(aes(x = com, y = position,
                 alpha = ifelse(position == max(position),0,1),
                 pch = "Center\nof Mass \nAbove"))+
  scale_alpha_identity()+
  scale_fill_manual(values = c("TRUE" = "forestgreen",
                               "FALSE" = "firebrick"))+
  scale_y_continuous(breaks = 0:50, minor_breaks = NULL)+
  labs(y = "height",
       shape = "",
       title = '{next_state}')+
  transition_states(states = paste("Iteration",stack,"-",
                                   "Block", frame),
                    transition_length = 0,
                    state_length = animation_things$frame_time)
Animate
Now we can make a gif!
animate(anim,
        nframes = ceiling(length(animation_things$frame_time)*1.0)+10,
        fps = 1,
        height = 4,
        width = 5,
        units = "in",
        res = 100)